 Echarts字体和线条颜色设置操作笔记.docx
- 文档编号:24739156
- 上传时间:2023-06-01
- 格式:DOCX
- 页数:45
- 大小:1.14MB
Echarts字体和线条颜色设置操作笔记.docx
《Echarts字体和线条颜色设置操作笔记.docx》由会员分享,可在线阅读,更多相关《Echarts字体和线条颜色设置操作笔记.docx(45页珍藏版)》请在冰豆网上搜索。

Echarts字体和线条颜色设置操作笔记
Echarts字体和线条颜色设置操作笔记
这篇文章主要讲述Echarts设置字体和线条的颜色相关操作笔记,希望文章对你有所帮助,主要是自己的在线笔记吧。
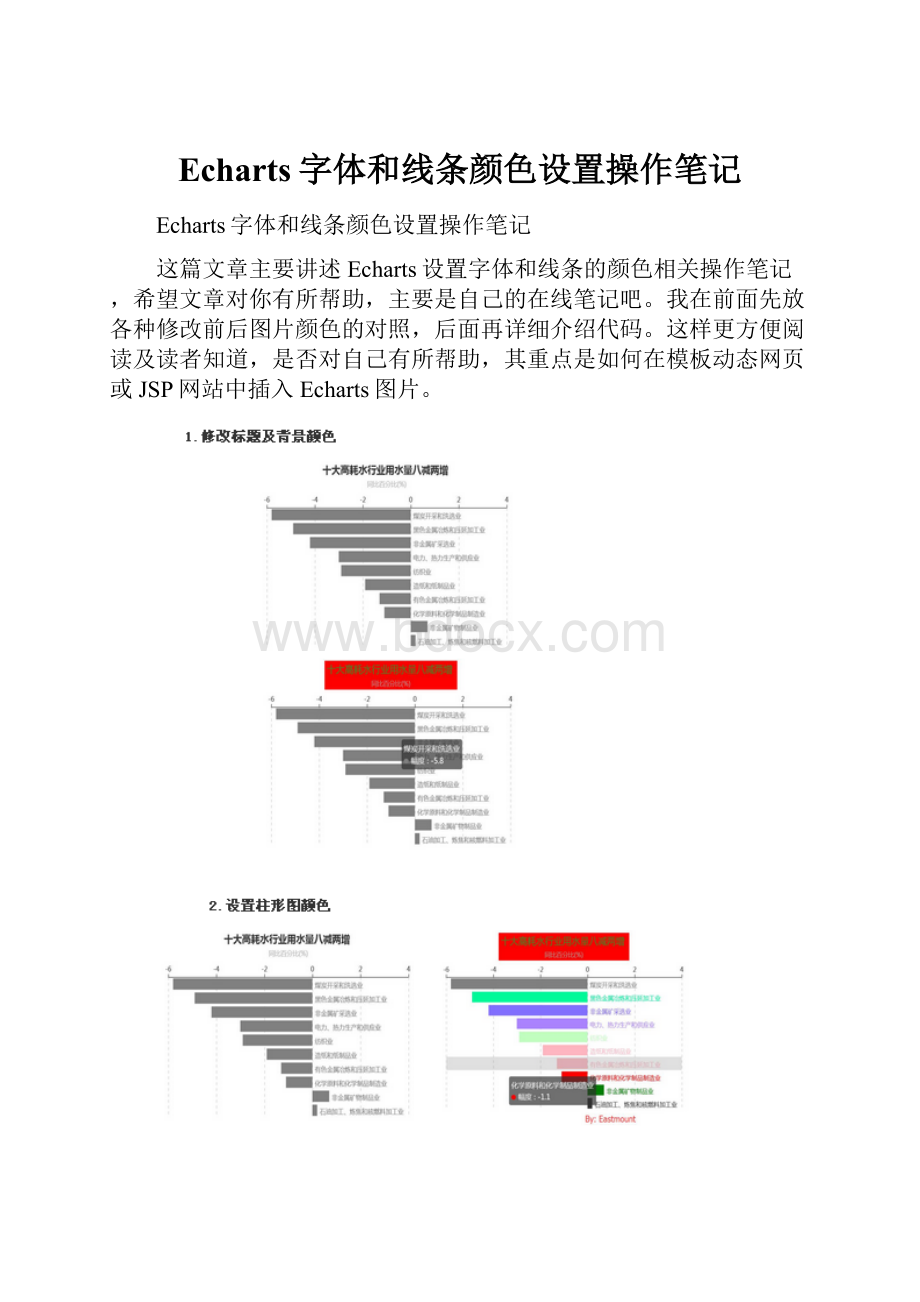
我在前面先放各种修改前后图片颜色的对照,后面再详细介绍代码。
这样更方便阅读及读者知道,是否对自己有所帮助,其重点是如何在模板动态网页或JSP网站中插入Echarts图片。
1.修改标题的颜色及背景
Echarts绘制柱状图及修改标题颜色的代码如下所示:
[html]viewplaincopy在CODE上查看代码片派生到我的代码片
DOCTYPEhtml>
600px;height: 400px;">
varmyChart=echarts.init(document.getElementById('main'));
varlabelRight={
normal:
{position:
'right'}
};
varlabelRight={
normal:
{position:
'right'}
};
varoption={
title:
{
text:
'十大高耗水行业用水量八减两增',//标题
backgroundColor:
'#ff0000',//背景
subtext:
'同比百分比(%)',//子标题
textStyle:
{
fontWeight:
'normal',//标题颜色
color:
'#408829'
},
x:
"center"
},
legend:
{
data:
['蒸发量','降水量','最低气温','最高气温']
},
tooltip:
{
trigger:
'axis',
axisPointer:
{
//坐标轴指示器,坐标轴触发有效
type:
'shadow'
//默认为直线,可选为:
'line'|'shadow'
}
},
grid:
{
top:
80,
bottom:
80
},
xAxis:
{//设置x轴
type:
'value',
position:
'top',
splitLine:
{lineStyle:
{type:
'dashed'}},
max:
'4',
},
yAxis:
{
type:
'category',
axisLine:
{show:
false},
axisLabel:
{show:
false},
axisTick:
{show:
false},
splitLine:
{show:
false},
data:
['石油加工、炼焦和核燃料加工业',
'非金属矿物制品业',
'化学原料和化学制品制造业',
'有色金属冶炼和压延加工业',
'造纸和纸制品业','纺织业',
'电力、热力生产和供应业',
'非金属矿采选业',
'黑色金属冶炼和压延加工业',
'煤炭开采和洗选业'
]
},
series:
[
{
name:
'幅度',
type:
'bar',
stack:
'总量',
label:
{
normal:
{
show:
true,
formatter:
'{b}'
}
},
data:
[
{value:
0.2,label:
labelRight,itemStyle:
{normal:
{color:
'gray'}}},
{value:
0.7,label:
labelRight,itemStyle:
{normal:
{color:
'gray'}}},
{value:
-1.1,label:
labelRight,itemStyle:
{normal:
{color:
'gray'}}},
{value:
-1.3,label:
labelRight,itemStyle:
{normal:
{color:
'gray'}}},
{value:
-1.9,label:
labelRight,itemStyle:
{normal:
{color:
'gray'}}},
{value:
-2.9,label:
labelRight,itemStyle:
{normal:
{color:
'gray'}}},
{value:
-3.0,label:
labelRight,itemStyle:
{normal:
{color:
'gray'}}},
{value:
-4.2,label:
labelRight,itemStyle:
{normal:
{color:
'gray'}}},
{value:
-4.9,label:
labelRight,itemStyle:
{normal:
{color:
'gray'}}},
{value:
-5.8,label:
labelRight,itemStyle:
{normal:
{color:
'gray'}}},
]
}
]
};
myChart.setOption(option);
window.addEventListener("resize",function(){
myChart.resize();
});
600px;height: 400px;">
其中设置颜色标题的核心代码:
[html]viewplaincopy在CODE上查看代码片派生到我的代码片
title:
{
text:
'十大高耗水行业用水量八减两增',//标题
backgroundColor:
'#ff0000',//背景
subtext:
'同比百分比(%)',//子标题
textStyle:
{
fontWeight:
'normal',//标题颜色
color:
'#408829'
},
x:
"center"
},
输出如下图所示:
2.设置柱形图颜色
设置柱形图颜色代码如下所示,其中颜色表参考:
RGB颜色查询对照表
[html]viewplaincopy在CODE上查看代码片派生到我的代码片
series:
[
{
name:
'幅度',
type:
'bar',
stack:
'总量',
label:
{
normal:
{
show:
true,
formatter:
'{b}'
}
},
data:
[
{value:
0.2,label:
labelRight,itemStyle:
{normal:
{color:
'bule'}}},
{value:
0.7,label:
labelRight,itemStyle:
{normal:
{color:
'green'}}},
{value:
-1.1,label:
labelRight,itemStyle:
{normal:
{color:
'red'}}},
{value:
-1.3,label:
labelRight,itemStyle:
{normal:
{color:
'#FFB6C1'}}},
{value:
-1.9,label:
labelRight,itemStyle:
{normal:
{color:
'#EE7AE9y'}}},
{value:
-2.9,label:
labelRight,itemStyle:
{normal:
{color:
'#C1FFC1'}}},
{value:
-3.0,label:
labelRight,itemStyle:
{normal:
{color:
'#AB82FF'}}},
{value:
-4.2,label:
labelRight,itemStyle:
{normal:
{color:
'#836FFF'}}},
{value:
-4.9,label:
labelRight,itemStyle:
{normal:
{color:
'#00FA9A'}}},
{value:
-5.8,label:
labelRight,itemStyle:
{normal:
{color:
'#CD00CD'}}},
]
}
输出如下图所示:
3.修改坐标字体颜色
完整代码:
[html]viewplaincopy在CODE上查看代码片派生到我的代码片
DOCTYPEhtml>
--引入echarts.js-->
--为ECharts准备一个具备大小(宽高)的Dom-->
900px;height: 500px;">
//基于准备好的dom,初始化echarts实例
varmyChart=echarts.init(document.getElementById('main'));
option={
title:
{
text:
'2016年上半年全国规模以上工业企业用水情况(单位:
亿立方米)',
subtext:
'数据来源:
国家统计局',
x:
'center',
},
tooltip:
{
trigger:
'axis',
axisPointer:
{
//坐标轴指示器,坐标轴触发有效
type:
'shadow'
//默认为直线,可选为:
'line'|'shadow'
}
},
legend:
{
orient:
'vertical',
x:
'left',
y:
"top",
padding:
50,
data:
['用水量','减少量',]
},
grid:
{
left:
'10',
right:
'60',
bottom:
'3%',
height:
'30%',
top:
'20%',
containLabel:
true
},
xAxis:
{
type:
'value',
//设置坐标轴字体颜色和宽度
axisLine:
{
lineStyle:
{
color:
'yellow',
width:
2
}
},
},
yAxis:
{
type:
'category',
//设置坐标轴字体颜色和宽度
axisLine:
{
lineStyle:
{
color:
'yellow',
width:
2
}
},
data:
['东部地区','中部地区','西部地区',]
},
series:
[
{
name:
'用水量',
type:
'bar',
stack:
'总量',
label:
{
normal:
{
show:
true,
position:
'insidelift'
}
},
data:
[109.2,48.2,41]
},
{
name:
'减少量',
type:
'bar',
stack:
'总量',
label:
{
normal:
{
show:
true,
position:
'insidelift'
}
},
data:
[1.638,1.0122,1.025]
},
]
};
myChart.setOption(option);
核心代码如下所示:
[html]viewplaincopy在CODE上查看代码片派生到我的代码片
yAxis:
{
type:
'category',
//设置坐标轴字体颜色和宽度
axisLine:
{
lineStyle:
{
color:
'yellow',
width:
2
}
},
data:
['东部地区','中部地区','西部地区',]
},
输出如下图所示:
4.设置了legend颜色
核心代码代码如下:
[html]viewplaincopy在CODE上查看代码片派生到我的代码片
legend:
{
orient:
'vertical',
//data:
['用水量','减少量'],
data:
[{name:
'用水量',
textStyle:
{color:
"#25c36c"}
},
{name:
'减少量',
textStyle:
{color:
"#25c36c"}}
],
x:
'left',
y:
"top",
padding:
50,
},
输出如下图所示:
5.修改折现颜色
代码如下所示:
[html]viewplaincopy在CODE上查看代码片派生到我的代码片
DOCTYPEhtml>
--引入echarts.js-->
--为ECharts准备一个具备大小(宽高)的Dom-->
600px;height: 400px;">
//基于准备好的dom,初始化echarts实例
varmyChart=echarts.init(document.getElementById('main'));
vartimeData=[
'海水','陆地苦咸水','矿井水',
'雨水','再生水','海水淡化水'];
timeData=timeData.map(function(str){
returnr.replace('2016/','');
});
option={
title:
{
text:
'2016年上半年全国工业用水增长率',
x:
'center'
},
tooltip:
{
trigger:
'axis',
axisPointer:
{
animation:
false
}
},
legend:
{
data:
['常规用水量','非常规用水量'],
x:
"right",
y:
"top",
padding:
50
},
grid:
[{
left:
100,
right:
100,
height:
'20%',
top:
'25%'
},
{
left:
100,
right:
100,
top:
'65%',
height:
'25%'
}],
xAxis:
[
{
type:
'category',
boundaryGap:
false,
axisLine:
{onZero:
true},
data:
['地表淡水','地下淡水','自来水','其他水']
},
{
gridIndex:
1,
type:
'category',
boundaryGap:
false,
axisLine:
{onZero:
true},
data:
timeData,
position:
'top'
}
],
yAxis:
[
{
name:
'常规用水量(%)',
type:
'value',
max:
5
},
{
gridIndex:
1,
name:
'非常规用水量(%)',
type:
'value',
inverse:
true
}
],
series:
[
{
name:
'常规用水量',
type:
'line',
symbolSize:
8,
//设置折线图颜色
itemStyle:
{
normal:
{
lineStyle:
{
color:
'#ff0000'
}
}
},
hoverAnimation:
false,
data:
[-3.8,-9.0,0.0,4.5]
},
{
name:
'非常规用水量',
type:
'line',
xAxisIndex:
1,
yAxisIndex:
1,
symbolSize:
8,
//设置折线图颜色
itemStyle:
{
normal:
{
lineStyle:
{
color:
'#0000ff'
}
}
},
hoverAnimation:
false,
data:
[-5.8,-2.5,6.2,50.3,3.5,-3.3]
}
]
};
myChart.setOption(option);
其中修改折现颜色代码如下所示:
[html]viewplaincopy在CODE上查看代码片派生到我的代码片
series:
[
{
name:
'常规用水量',
type:
'line',
symbolSize:
8,
itemStyle:
{
normal:
{
lineStyle:
{
color:
'#ff0000'
}
}
},
hoverAnimation:
false,
data:
[-3.8,-9.0,0.0,4.5]
},
{
name:
'非常规用水量',
type:
'line',
xAxisIndex:
1,
yAxisIndex:
1,
itemStyle:
{
normal:
{
lineStyle:
{
color:
'#ff0000'
}
}
},
symbolSize:
8,
hoverAnimation:
false,
data:
[-5.8,-2.5,6.2,50.3,3.5,-3.3]
}
]
修改图如下所示:
6.修改油表盘字体大小及颜色
核心代码如下所示:
[html]viewplaincopy在CODE上查看代码片派生到我的代码片
DOCTYPEhtml>
--引入echarts.js-->
--为ECharts准备一个具备大小(宽高)的Dom-->
800px;height: 600px;">


 《包装概论》课后习题汇总.docx
