 CH06RiskandRatesofReturn(财务管理,英文版).pptx
- 文档编号:30795820
- 上传时间:2023-10-09
- 格式:PPTX
- 页数:55
- 大小:238.71KB
CH06RiskandRatesofReturn(财务管理,英文版).pptx
《CH06RiskandRatesofReturn(财务管理,英文版).pptx》由会员分享,可在线阅读,更多相关《CH06RiskandRatesofReturn(财务管理,英文版).pptx(55页珍藏版)》请在冰豆网上搜索。

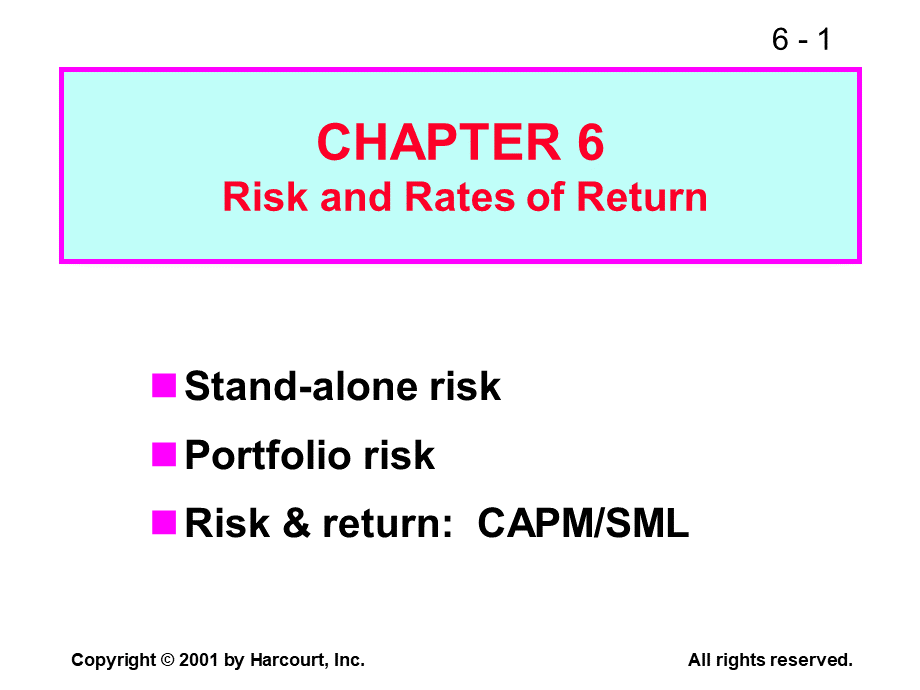
CHAPTER6RiskandRatesofReturn,Stand-aloneriskPortfolioriskRisk&return:
CAPM/SML,Whatisinvestmentrisk?
Investmentriskpertainstotheprobabilityofactuallyearningalowornegativereturn.Thegreaterthechanceoflowornegativereturns,theriskiertheinvestment.,Probabilitydistribution,ExpectedRateofReturn,Rateofreturn(%),100,15,0,-70,FirmX,FirmY,AnnualTotalReturns,1926-1998,AverageStandardReturnDeviationDistribution,Small-companystocks17.4%33.8%Large-companystocks13.220.3Long-termcorporatebonds6.18.6Long-termgovernment5.79.2Intermediate-termgovernment5.55.7U.S.Treasurybills3.83.2Inflation3.24.5,InvestmentAlternatives(Givenintheproblem),Economy,Prob.,T-Bill,HT,Coll,USR,MP,Recession0.18.0%-22.0%28.0%10.0%-13.0%Belowavg.0.28.0-2.014.7-10.01.0Average0.48.020.00.07.015.0Aboveavg.0.28.035.0-10.045.029.0Boom0.18.050.0-20.030.043.01.0,WhyistheT-billreturnindependentoftheeconomy?
Willreturnthepromised8%regardlessoftheeconomy.,DoT-billspromiseacompletelyrisk-freereturn?
No,T-billsarestillexposedtotheriskofinflation.However,notmuchunexpectedinflationislikelytooccuroverarelativelyshortperiod.,DothereturnsofHTandColl.movewithorcountertotheeconomy?
HT:
Moveswiththeeconomy,andhasapositivecorrelation.Thisistypical.Coll:
Iscountercyclicaloftheeconomy,andhasanegativecorrelation.Thisisunusual.,Calculatetheexpectedrateofreturnoneachalternative:
k=expectedrateofreturn.,kHT=(-22%)0.1+(-2%)0.20+(20%)0.40+(35%)0.20+(50%)0.1=17.4%.,k,HT,17.4%,Market,15.0,USR,13.8,T-bill,8.0,Coll.,1.7,HTappearstobethebest,butisitreally?
Whatsthestandarddeviationofreturnsforeachalternative?
=Standarddeviation.=,sT-bills=0.0%.,sHT=20.0%.,sColl=13.4%.sUSR=18.8%.sM=15.3%.,1/2,s,T,-,bills,=,(8.08.0)20.1+(8.08.0)20.2+(8.08.0)20.4+(8.08.0)20.2+(8.08.0)20.1,Prob.,RateofReturn(%),T-bill,USR,HT,0,8,13.8,17.4,Standarddeviation(si)measurestotal,orstand-alone,risk.Thelargerthesi,thelowertheprobabilitythatactualreturnswillbeclosetotheexpectedreturn.,ExpectedReturnsvs.Risk,Security,Expected,return,Risk,s,HT17.4%20.0%Market15.015.3USR13.8*18.8*T-bills8.00.0Coll.1.7*13.4*,*Seemsmisplaced.,CoefficientofVariation(CV),Standardizedmeasureofdispersionabouttheexpectedvalue:
Showsriskperunitofreturn.,CV=.,Stddevs,k,Mean,0,A,B,sA=sB,butAisriskierbecauselargerprobabilityoflosses.,=CVACVB.,s,k,PortfolioRiskandReturn,Assumeatwo-stockportfoliowith$50,000inHTand$50,000inCollections.,Calculatekpandsp.,PortfolioReturn,kp,kpisaweightedaverage:
kp=0.5(17.4%)+0.5(1.7%)=9.6%.,kpisbetweenkHTandkCOLL.,kp=Swiki.,n,i=1,AlternativeMethod,kp=(3.0%)0.10+(6.4%)0.20+(10.0%)0.40+(12.5%)0.20+(15.0%)0.10=9.6%.,EstimatedReturn,Economy,Prob.,HT,Coll.,Port.,Recession0.10-22.0%28.0%3.0%Belowavg.0.20-2.014.76.4Average0.4020.00.010.0Aboveavg.0.2035.0-10.012.5Boom0.1050.0-20.015.0,CVp=0.34.,3.3%,9.6%,p=3.3%.,1,2,/,(3.09.6)20.10+(6.49.6)20.20+(10.09.6)20.40+(12.59.6)20.20+(15.09.6)20.10,sp=3.3%ismuchlowerthanthatofeitherstock(20%and13.4%).sp=3.3%islowerthanaverageofHTandColl=16.7%.Portfolioprovidesaveragekbutlowerrisk.Reason:
negativecorrelation.,Generalstatementsaboutrisk,Moststocksarepositivelycorrelated.rk,m0.65.s35%foranaveragestock.Combiningstocksgenerallylowersrisk.,ReturnsDistributionforTwoPerfectlyNegativelyCorrelatedStocks(r=-1.0)andforPortfolioWM,25,15,0,-10,-10,-10,0,0,15,15,25,25,StockW,StockM,PortfolioWM,.,.,.,.,.,.,.,.,.,.,.,.,.,.,.,ReturnsDistributionsforTwoPerfectlyPositivelyCorrelatedStocks(r=+1.0)andforPortfolioMM,StockM,StockM,PortfolioMM,0,15,25,-10,Whatwouldhappentotheriskinessofanaverage1-stockportfolioasmorerandomlyselectedstockswereadded?
spwoulddecreasebecausetheaddedstockswouldnotbeperfectlycorrelatedbutkpwouldremainrelativelyconstant.,Large,0,15,Prob.,2,1,EvenwithlargeN,sp20%,#StocksinPortfolio,102030402,000+,CompanySpecificRisk,MarketRisk,200,Stand-AloneRisk,sp,sp(%),35,Asmorestocksareadded,eachnewstockhasasmallerrisk-reducingimpact.spfallsveryslowlyafterabout10stocksareincluded,andafter40stocks,thereislittle,ifany,effect.Thelowerlimitforspisabout20%=sM.,Stand-aloneMarketFirm-specific,Marketriskisthatpartofasecuritysstand-aloneriskthatcannotbeeliminatedbydiversification,andismeasuredbybeta.Firm-specificriskisthatpartofasecuritysstand-aloneriskthatcanbeeliminatedbyproperdiversification.,riskriskrisk,=+,Byformingportfolios,wecaneliminateabouthalftheriskinessofindividualstocks(35%vs.20%).,Ifyouchosetoholdaone-stockportfolioandthusareexposedtomoreriskthandiversifiedinvestors,wouldyoubecompensatedforalltheriskyoubear?
NO!
Stand-aloneriskasmeasuredbyastockssorCVisnotimportanttoawell-diversifiedinvestor.Rational,riskaverseinvestorsareconcernedwithsp,whichisbasedonmarketrisk.,Therecanonlybeoneprice,hencemarketreturn,foragivensecurity.Therefore,nocompensationcanbeearnedfortheadditionalriskofaone-stockportfolio.,Betameasuresastocksmarketrisk.Itshowsastocksvolatilityrelativetothemarket.,Betashowshowriskyastockisifthestockisheldinawell-diversifiedportfolio.,Howarebetascalculated?
RunaregressionofpastreturnsonStockiversusreturnsonthemarket.Returns=D/P+g.Theslopeoftheregressionlineisdefinedasthebetacoefficient.,YearkMki115%18%2-5-1031216,.,.,.,kM,_,-505101520,2015105,-5-10,Illustrationofbetacalculation:
Regressionline:
ki=-2.59+1.44kM,Ifbeta=1.0,averagestock.Ifbeta1.0,stockriskierthanaverage.Ifbeta1.0,stocklessriskythanaverage.Moststockshavebetasintherangeof0.5to1.5.,ListofBetaCoefficients,StockBeta,MerrillLynch2.00AmericaOnline1.70GeneralElectric1.20MicrosoftCorp.1.10Coca-Cola1.05IBM1.05Procter&Gamble0.85Heinz0.80EnergenCorp.0.80EmpireDistrictElectric0.45,Canabetabenegative?
Answer:
Yes,ifri,misnegative.Thenina“betagraph”theregressionlinewillslopedownward.Though,anegativebetaishighlyunlikely.,HT,T-Bills,b=0,ki,_,kM,_,-2002040,4020,-20,b=1.29,Coll.,b=-0.86,Riskiersecuritieshavehigherreturns,sotherankorderisOK.,HT17.4%1.29Market15.01.00USR13.80.68T-bills8.00.00Coll.1.7-0.86,ExpectedRiskSecurityReturn(Beta),UsetheSMLtocalculatetherequiredreturns.,AssumekRF=8%.NotethatkM=kMis15%.(Equil.)RPM=kMkRF=15%8%=7%.,SML:
ki=kRF+(kMkRF)bi.,RequiredRatesofReturn,kHT=8.0%+(15.0%8.0%)(1.29)=8.0%+(7%)(1.29)=8.0%+9.0%=17.0%.,kM=8.0%+(7%)(1.00)=15.0%.kUSR=8.0%+(7%)(0.68)=12.8%.kT-bill=8.0%+(7%)(0.00)=8.0%.kColl=8.0%+(7%)(-0.86)=2.0%.,HT17.4%17.0%Undervalued:
kkMarket15.015.0FairlyvaluedUSR13.812.8Undervalued:
kkT-bills8.08.0FairlyvaluedColl.1.72.0Overvalued:
kk,Expectedvs.RequiredReturns,k,k,.,.,Coll.,.,HT,T-bills,.,USR,SML,kM=15kRF=8,-1012,.,SML:
ki=8%+(15%8%)bi.,ki(%),Risk,bi,Calculatebetaforaportfoliowith50%HTand50%Collections,bp=Weightedaverage=0.5(bHT)+0.5(bColl)=0.5(1.29)+0.5(-0.86)=0.22.,TherequiredreturnontheHT/Coll.portfoliois:
kp=Weightedaveragek=0.5(17%)+0.5(2%)=9.5%.OruseSML:
kp=kRF+(kMkRF)bp=8.0%+(15.0%8.0%)(0.22)=8.0%+7%(0.22)=9.5%.,Ifinvestorsraiseinflationexpectationsby3%,whatwouldhappentotheSML?
SML1,Originalsituation,RequiredRateofReturnk(%),SML2,00.51.01.5Risk,bi,1815118,NewSML,DI=3%,Ifinflationdidnotchangebutriskaversionincreasedenoughtocausethemarketriskpremiumtoincreaseby3percentagepoints,whatwouldhappentotheSML?
kM=18%kM=15%,SML1,Originalsituation,RequiredRateofReturn(%),SML2,Afterincreaseinriskaversion,Risk,bi,1815,8,1.0,DRPM=3%,HastheCAPMbeenverifiedthroughempiricaltests?
Notcompletely.Thosestatisticaltestshaveproblemsthatmakeverificationalmostimpossible.,Investorsseemtobeconcernedwithbothmarketriskandtotalrisk.Therefore,theSMLmaynotproduceacorrectestimateofki:
ki=kRF+(kMkRF)b+?
Also,CAPM/SMLconceptsarebasedonexpectations,yetbetasarecalculatedusinghistoricaldata.Acompanyshistoricaldatamaynotreflectinvestorsexpectationsaboutfutureriskiness.,
- 配套讲稿:
如PPT文件的首页显示word图标,表示该PPT已包含配套word讲稿。双击word图标可打开word文档。
- 特殊限制:
部分文档作品中含有的国旗、国徽等图片,仅作为作品整体效果示例展示,禁止商用。设计者仅对作品中独创性部分享有著作权。
- 关 键 词:
- CH06RiskandRatesofReturn 财务管理 英文
 冰豆网所有资源均是用户自行上传分享,仅供网友学习交流,未经上传用户书面授权,请勿作他用。


 3第三章电子商务基本模式的交易流程.pptx
 六西格玛黑带模拟测试题及答案四.docx
