 SPSS应用.docx
- 文档编号:29856645
- 上传时间:2023-07-27
- 格式:DOCX
- 页数:99
- 大小:36.35KB
SPSS应用.docx
《SPSS应用.docx》由会员分享,可在线阅读,更多相关《SPSS应用.docx(99页珍藏版)》请在冰豆网上搜索。
SPSS应用
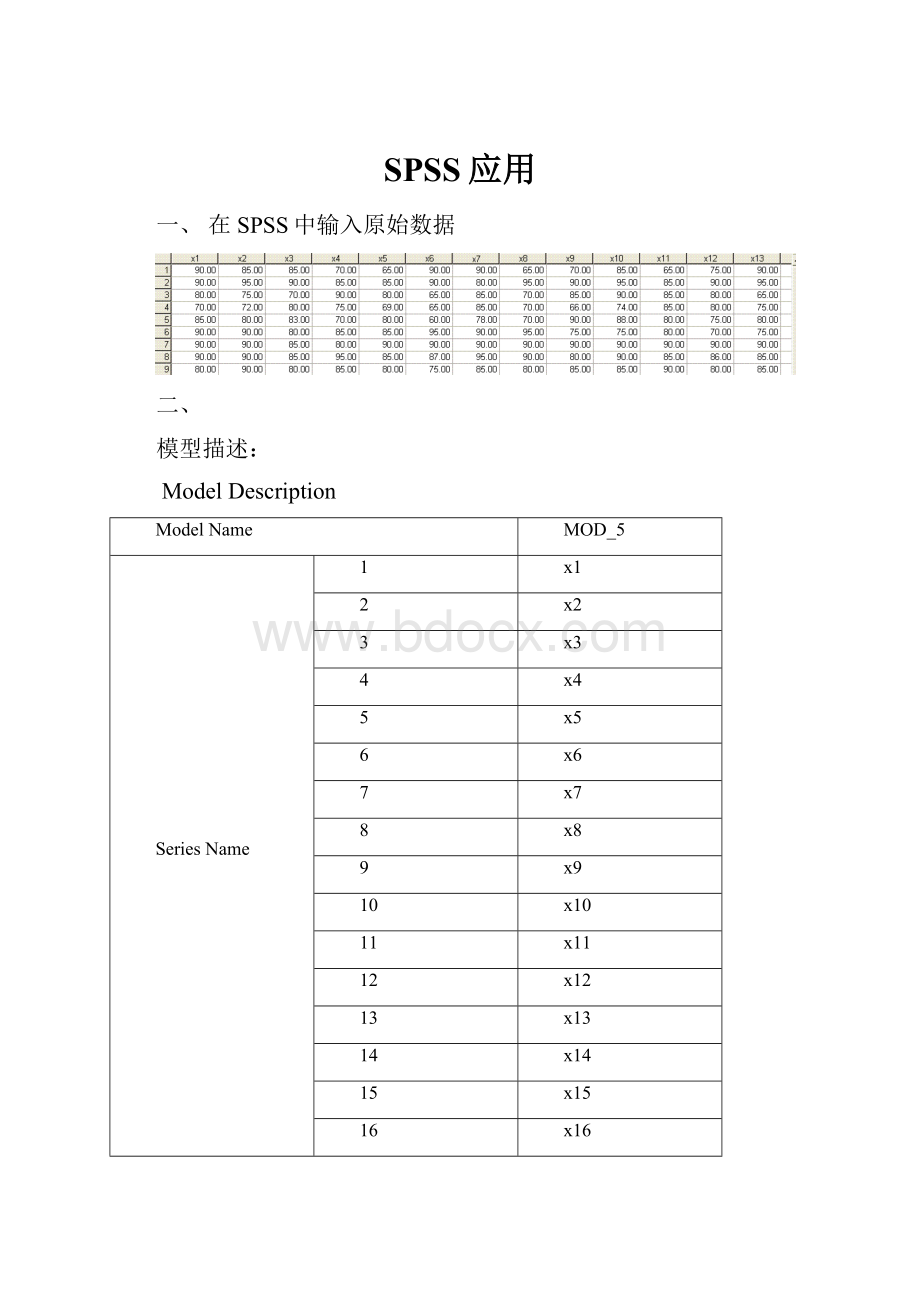
一、在SPSS中输入原始数据
二、
模型描述:
ModelDescription
ModelName
MOD_5
SeriesName
1
x1
2
x2
3
x3
4
x4
5
x5
6
x6
7
x7
8
x8
9
x9
10
x10
11
x11
12
x12
13
x13
14
x14
15
x15
16
x16
17
x17
18
x18
19
x19
20
x20
21
x21
22
x22
23
x23
24
x24
Transformation
None
Non-SeasonalDifferencing
0
SeasonalDifferencing
0
LengthofSeasonalPeriod
Noperiodicity
MaximumNumberofLags
16
ProcessAssumedforCalculatingtheStandardErrorsoftheAutocorrelations
Independence(whitenoise)(a)
DisplayandPlot
Alllags
以一个x1自变量自相关为例:
Autocorrelations
Series:
x1
Lag
Autocorrelation
Std.Error(a)
Box-LjungStatistic
Value
df
Sig.(b)
1
.250
.284
.773
1
.379
2
-.438
.266
3.480
2
.175
3
-.500
.246
7.605
3
.055
4
-.188
.225
8.302
4
.081
5
.250
.201
9.848
5
.080
6
.188
.174
11.009
6
.088
7
.000
.142
11.009
7
.138
PartialAutocorrelations
Series:
x1
Lag
PartialAutocorrelation
Std.Error
1
.250
.333
2
-.533
.333
3
-.297
.333
4
-.301
.333
5
-.040
.333
6
-.346
.333
7
-.155
.333
临近矩阵:
ProximityMatrix
EuclideanDistance
1
2
3
4
5
6
7
8
9
1
.000
75.624
72.519
70.541
69.957
65.567
78.032
72.319
72.069
2
75.624
.000
61.237
77.505
53.470
49.497
26.458
41.964
40.311
3
72.519
61.237
.000
57.940
37.135
62.849
55.678
60.341
45.000
4
70.541
77.505
57.940
.000
54.387
65.399
80.231
61.790
51.981
5
69.957
53.470
37.135
54.387
.000
59.489
52.906
62.209
36.661
6
65.567
49.497
62.849
65.399
59.489
.000
49.497
44.844
42.131
7
78.032
26.458
55.678
80.231
52.906
49.497
.000
47.127
42.131
8
72.319
41.964
60.341
61.790
62.209
44.844
47.127
.000
46.433
9
72.069
40.311
45.000
51.981
36.661
42.131
42.131
46.433
.000
残差分析:
DescriptiveStatistics
x1
x2
x3
x4
x5
x6
x7
x8
x9
x10
x11
x12
x13
x14
x15
x16
x17
x18
x19
x20
x21
x22
x23
x24
ValidN(listwise)
N
9
9
9
9
9
9
9
9
9
9
9
9
9
9
9
9
9
9
9
9
9
9
9
9
9
Minimum
70.00
72.00
70.00
70.00
65.00
60.00
78.00
65.00
66.00
74.00
65.00
70.00
65.00
70.00
75.00
65.00
70.00
65.00
60.00
60.00
75.00
70.00
65.00
70.00
Maximum
90.00
95.00
90.00
95.00
90.00
95.00
95.00
95.00
90.00
95.00
90.00
90.00
95.00
95.00
90.00
90.00
90.00
90.00
90.00
90.00
98.00
90.00
92.00
95.00
Mean
85.0000
85.2222
82.0000
81.6667
79.8889
79.6667
86.4444
80.5556
81.2222
85.7778
82.7778
80.6667
82.2222
83.8889
81.8889
80.7778
82.5556
81.5556
78.8889
81.3333
86.3333
82.7778
83.5556
83.3333
Std.Deviation
7.07107
7.85458
5.56776
8.66025
8.06915
13.45362
5.36449
12.10487
9.06612
7.06714
7.54615
6.91014
9.39119
7.81736
5.88312
8.08977
7.74776
8.32333
8.57969
9.31397
7.44983
7.94949
9.87562
8.29156
因子分析:
Communalities
Initial
Extraction
x1
1.000
.906
x2
1.000
.932
x3
1.000
.970
x4
1.000
.793
x5
1.000
.972
x6
1.000
.948
x7
1.000
.892
x8
1.000
.943
x9
1.000
.962
x10
1.000
.918
x11
1.000
.910
x12
1.000
.889
x13
1.000
.942
x14
1.000
.941
x15
1.000
.859
x16
1.000
.894
x17
1.000
.960
x18
1.000
.923
x19
1.000
.942
x20
1.000
.971
x21
1.000
.949
x22
1.000
.942
x23
1.000
.979
x24
1.000
.970
TotalVarianceExplained
Component
InitialEigenvalues
ExtractionSumsofSquaredLoadings
Total
%ofVariance
Cumulative%
Total
%ofVariance
Cumulative%
1
8.069
33.620
33.620
8.069
33.620
33.620
2
5.843
24.345
57.965
5.843
24.345
57.965
3
4.213
17.553
75.518
4.213
17.553
75.518
4
2.119
8.830
84.348
2.119
8.830
84.348
5
2.065
8.603
92.951
2.065
8.603
92.951
6
.758
3.160
96.112
7
.632
2.634
98.746
8
.301
1.254
100.000
9
8.46E-016
3.53E-015
100.000
10
7.91E-016
3.29E-015
100.000
11
3.81E-016
1.59E-015
100.000
12
2.94E-016
1.22E-015
100.000
13
2.23E-016
9.29E-016
100.000
14
1.63E-016
6.81E-016
100.000
15
4.12E-017
1.72E-016
100.000
16
2.70E-017
1.13E-016
100.000
17
-3.98E-017
-1.66E-016
100.000
18
-8.31E-017
-3.46E-016
100.000
19
-1.79E-016
-7.45E-016
100.000
20
-3.49E-016
-1.45E-015
100.000
21
-4.41E-016
-1.84E-015
100.000
22
-4.69E-016
-1.96E-015
100.000
23
-6.93E-016
-2.89E-015
100.000
24
-1.60E-015
-6.67E-015
100.000
ComponentMatrix(a)
Component
1
2
3
4
5
x1
.495
.801
.020
-.072
.118
x2
.659
.568
-.302
-.287
-.031
x3
.313
.542
-.271
-.298
-.645
x4
.511
-.124
-.412
.487
.332
x5
.930
-.072
-.156
-.006
.277
x6
.312
.817
-.393
-.070
.154
x7
-.070
.491
-.530
.473
.377
x8
.748
.209
-.546
-.136
.153
x9
.863
-.146
.429
-.088
-.065
x10
.673
.196
.444
.325
-.352
x11
.646
-.647
-.251
.102
.032
x12
.669
.000
-.080
.424
-.506
x13
.380
.603
-.110
-.242
-.602
x14
.264
.674
.612
.202
.043
x15
.064
.837
-.071
.308
.234
x16
.516
.600
.388
.319
.123
x17
.807
-.318
.343
.274
-.121
x18
.623
-.623
.359
.130
-.034
x19
.767
-.558
.053
.132
.149
x20
.799
-.521
-.123
-.207
-.051
x21
-.175
.284
.912
.049
.054
x22
.127
.314
.760
-.216
.450
x23
.428
.004
.553
-.648
.266
x24
.677
-.070
-.385
-.488
.348
因子估计:
ParameterEstimates
y(a)
B
Std.Error
Wald
df
Sig.
Exp(B)
95%ConfidenceIntervalforExp(B)
LowerBound
UpperBound
76.00
Intercept
-20.002
22043.666
.000
1
.999
[x1=70.00]
40.003
27316.602
.000
1
.999
236121368189644000.000
.000
.(b)
[x1=80.00]
.000
5214.242
.000
1
1.000
1.000
.000
.(b)
[x1=85.00]
20.002
22143.636
.000
1
.999
485923212.236
.000
.(b)
[x1=90.00]
0(c)
.
.
0
.
.
.
.
[x2=72.00]
0(c)
.
.
0
.
.
.
.
[x2=75.00]
20.002
22749.263
.000
1
.999
485923212.236
.000
.(b)
[x2=80.00]
0(c)
.
.
0
.
.
.
.
[x2=85.00]
20.002
22143.636
.000
1
.999
485923212.236
.000
.(b)
[x2=90.00]
20.002
22143.525
.000
1
.999
485923212.236
.000
.(b)
[x2=95.00]
0(c)
.
.
0
.
.
.
.
[x3=70.00]
0(c)
.
.
0
.
.
.
.
[x3=80.00]
.000
5208.848
.000
1
1.000
1.000
.000
.(b)
[x3=83.00]
0(c)
.
.
0
.
.
.
.
[x3=85.00]
0(c)
.
.
0
.
.
.
.
[x3=90.00]
0(c)
.
.
0
.
.
.
.
[x4=70.00]
0(c)
.
.
0
.
.
.
.
[x4=75.00]
0(c)
.
.
0
.
.
.
.
[x4=80.00]
.000
5226.499
.000
1
1.000
1.000
.000
.(b)
[x4=85.00]
0(c)
.
.
0
.
.
.
.
[x4=90.00]
0(c)
.
.
0
.
.
.
.
[x4=95.00]
0(c)
.
.
0
.
.
.
.
[x5=65.00]
0(c)
.
.
0
.
.
.
.
[x5=69.00]
0(c)
.
.
0
.
.
.
.
[x5=80.00]
0(c)
.
.
0
.
.
.
.
[x5=85.00]
0(c)
.
.
0
.
.
.
.
[x5=90.00]
0(c)
.
.
0
.
.
.
.
[x6=60.00]
0(c)
.
.
0
.
.
.
.
[x6=65.00]
0(c)
.
.
0
.
.
.
.
[x6=75.00]
0(c)
.
.
0
.
.
.
.
[x6=87.00]
0(c)
.
.
0
.
.
.
.
[x6=90.00]
0(c)
.
.
0
.
.
.
.
[x6=95.00]
0(c)
.
.
0
.
.
.
.
[x7=78.00]
0(c)
.
.
0
.
.
.
.
[x7=80.00]
0(c)
.
.
0
.
.
.
.
[x7=85.00]
0(c)
.
.
0
.
.
.
.
[x7=90.00]
0(c)
.
.
0
.
.
.
.
[x7=95.00]
0(c)
.
.
0
.
.
.
.
[x8=65.00]
0(c)
.
.
0
.
.
.
.
[x8=70.00]
0(c)
.
.
0
.
.
.
.
[x8=80.00]
0(c)
.
.
0
.
.
.
.
[x8=90.00]
0(c)
.
.
0
.
.
.
.
[x8=95.00]
0(c)
.
.
0
.
.
.
.
[x9=66.00]
0(c)
.
.
0
.
.
.
.
[x9=70.00]
0(c)
.
.
0
.
.
.
.
[x9=75.00]
0(c)
.
.
0
.
.
.
.
[x9=80.00]
0(c)
.
.
0
.
.
.
.
[x9=85.00]
0(c)
.
.
0
.
.
.
.
[x9=90.00]
0(c)
.
.
0
.
.
.
.
[x10=74.00]
0(c)
.
.
0
.
.
.
.
[x10=75.00]
0(c)
.
.
0
.
.
.
.
[x10=85.00]
0(c)
.
.
0
.
.
.
.
[x10=88.00]
0(c)
.
.
0
.
.
.
.
[x10=90.00]
0(c)
.
.
0
.
.
.
.
[x10=95.00]
0(c)
.
.
0
.
.
.
.
[x11=65.00]
0(c)
.
.
0
.
.
.
.
[x11=80.00]
0(c)
.
.
0
.
.
.
.
[x11=85.00]
0(c)
.
.
0
.
.
.
.
[x11=90.00]
0(c)
.
.
0
.
.
.
.
[x12=70.00]
0(c)
.
.
0
.
.
.
.
[x12=75.00]
0(c)
.
.
0
.
.
.
.
[x12=80.00]
0(c)
.
.
0
.
.
.
.
[x12=86.00]
0(c)
.
.
0
.
.
.
.
[x12=90.00]
0(c)
.
.
0
.
.
.
.
[x13=65.00]
0(c)
.
.
0
.
.
.
.
[x13=75.00]
0(c)
.
.
0
.
.
.
.
[x13=80.00]
0(c)
.
.
0
.
.
.
.
[x13=85.00]
0(c)
.
.
0
.
.
.
.
[x13=90.00]
0(c)
.
.
0
.
.
.
.
[x13=95.00]
0(c)
.
.
0
.
.
.
.
[x14=70.00]
0(c)
.
.
0
.
.
.
.
[x14=80.00]
0(c)
.
.
0
.
.
.
.
[x14=90.00]
0(c)
.
.
0
.
.
.
.
[x14=95.00]
0(c)
.
.
0
.
.
.
.
[x15=75.00]
0(c)
.
.
0
.
.
.
.
[x15=77.00]
0(c)
.
.
0
.
.
.
.
[x15=80.00]
0(c)
.
.
0
.
.
.
.
[x15=85.00]
0(c)
.
.
0
.
.
.
.
[x15=90.00]
0(c)
.
.
0
.
.
.
.
[x16=65.00]
0(c)
.
.
0
.
.
.
.
[x16=70.00]
0(c)
.
.
0
.
.
.
.
[x16=80.00]
0(c)
.
.
0
.
.
.
.
[x16=82.00]
0(c)
.
.
0
.
.
.
.
[x16=85.00]
0(c)
.
.
0
.
.
.
.
[x16=90.00]
0(c)
.
.
0
.
.
.
.
[x17=70.00]
0(c)
.
.
0
.
.
.
.
[x17=75.00]
0(c)
.
.
0
.
.
.
.
[x17=80.00]
0(c)
.
.
0
.
.
.
.
[x17=85.00]
0(c)
.
.
0
.
.
.
.
[x17=88.00]
0(c)
.
.
0
.
.
.
.
[x17=90.00]
0(c)
.
.
0
.
.
.
.
[x18=65.00]
0(c)
.
.
0
.
.
.
.
[x18=75.00]
0(c)
.
.
0
.
.
.
.
[x18=79.00]
0(c)
.


- 配套讲稿:
如PPT文件的首页显示word图标,表示该PPT已包含配套word讲稿。双击word图标可打开word文档。
- 特殊限制:
部分文档作品中含有的国旗、国徽等图片,仅作为作品整体效果示例展示,禁止商用。设计者仅对作品中独创性部分享有著作权。
- 关 键 词:
- SPSS 应用
 冰豆网所有资源均是用户自行上传分享,仅供网友学习交流,未经上传用户书面授权,请勿作他用。
 #2机组现场施工用电布置措施.docx
-
《个人贵金属质押借款合同》兴业银行.docx
-
《科学发展观和小康社会的经济建设》复习导学案.docx
-
《我和祖父的园子》第一课时教案两篇word.docx
-
《质量》教学案例与设计.docx
-
2惠农小册子.docx
-
7A版个人与团队模拟考试题及答案.docx
-
10篇新部编四年级下册语文课内外阅读理解专项练习题及答案.docx
-
16初四物理热和能知识点总结精讲.docx
-
20XX社会语言经典语录流行风暴.docx
-
48篇教学案例分析报告题.docx
-
《电子工厂安全管理制度汇总》.docx
-
《机械制造课程设计》指导.docx
-
《钱学森》教案第二课时.docx
-
《边城》读后感5篇.docx
-
《固定式压力容器安全技术监察规程》.docx
-
《论雷峰塔的倒掉》.docx
-
《手术台就是阵地》教学设计三年级语文下册.docx
-
《夏洛的网》课外阅读教学设计.docx
-
《自己的花是让别人看的》教案.docx
-
3C检查表090429.docx
-
7客运专线CRTSⅡ型板式无砟轨道施工工法.docx
-
《笔算除法》课时教案设计.docx
-
11#楼高大模板支撑体系专项方案.docx
-
17科学分析经济形势.docx
-
《电流和电路》易错题精讲综合检测题与答案.docx
-
《会计信息系统》习题含答案.docx
-
《汽车电器设备与维修》发电机分教考分离试题及标准答案.docx
-
《四川省排污许可证管理暂行办法》.docx
-
《新编实用英语》教案第一册Unit.docx
-
0母版锅炉值班员计算题WORD版.docx
-
3年级下册英语单词记忆人教版.docx
 改变要从心开始.pptx
-
感悟岁之前不在乎的事.pptx
-
钢筋放样基本方法概论.pptx
-
赶集网企业管理知识培训资料.pptx
-
高成熟度企业量化管理实践.pptx
-
高级财务管理第三章企业集团财务管理.pptx
-
高级财务管理8跨国公司财务管理.pptx
-
高级管理学第二讲企业间组织形态.pptx
-
钢铁公司职位管理体系分析.pptx
-
高级企业培训BPR管理知识理论.pptx
-
高级企业人力资源管理师第六章劳动关系管理.pptx
-
高科技公司的组织管理(3).pptx
-
高科技公司的组织管理(PPT 17页).pptx
-
高阶企业管理硕士班.pptx
-
高速铁路桥隧建筑物修理规则.pptx
-
高科技公司的组织管理.pptx
-
高科技公司的組织管理.pptx
-
高校就业工作的新要求概论.pptx
-
高效的工作方法概述.pptx
